WordPress SEO performance is easier to measure when you stop chasing plugin scores and start tracking three things together: search visibility, page engagement, and business outcomes. The useful question is not whether a plugin says a page is “green.” It is whether the right pages are earning impressions, clicks, leads, and steady improvement over time.
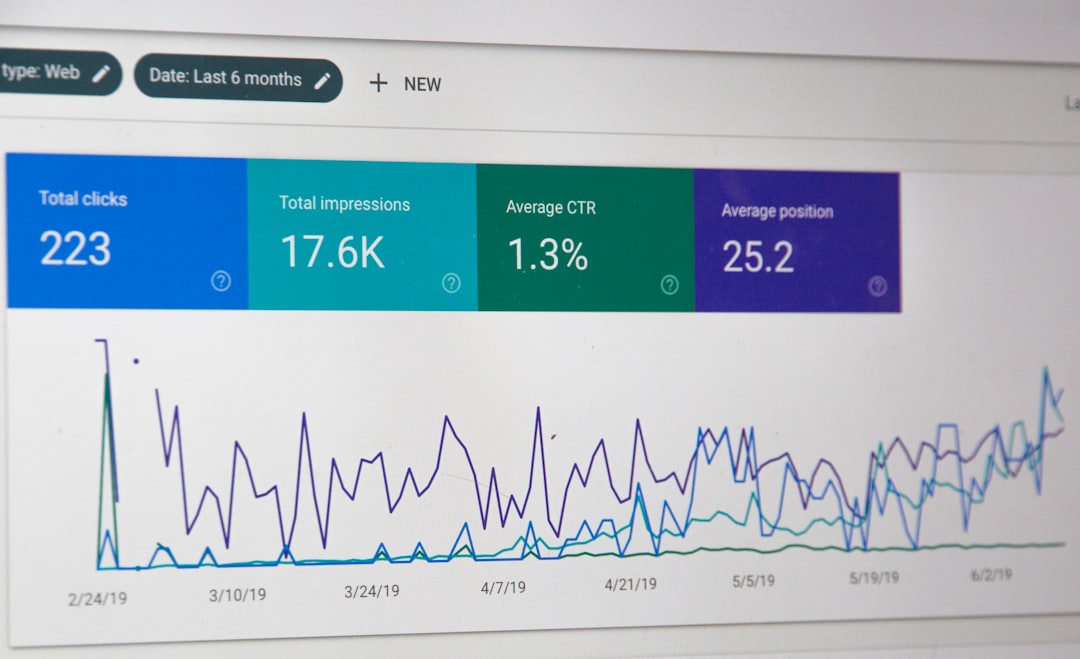
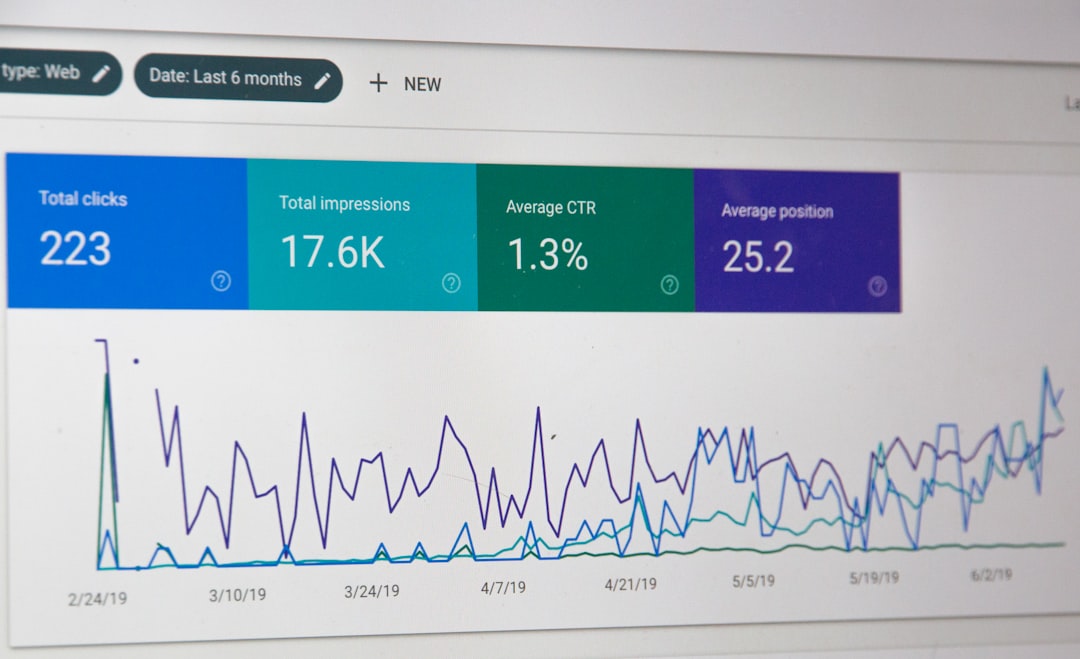
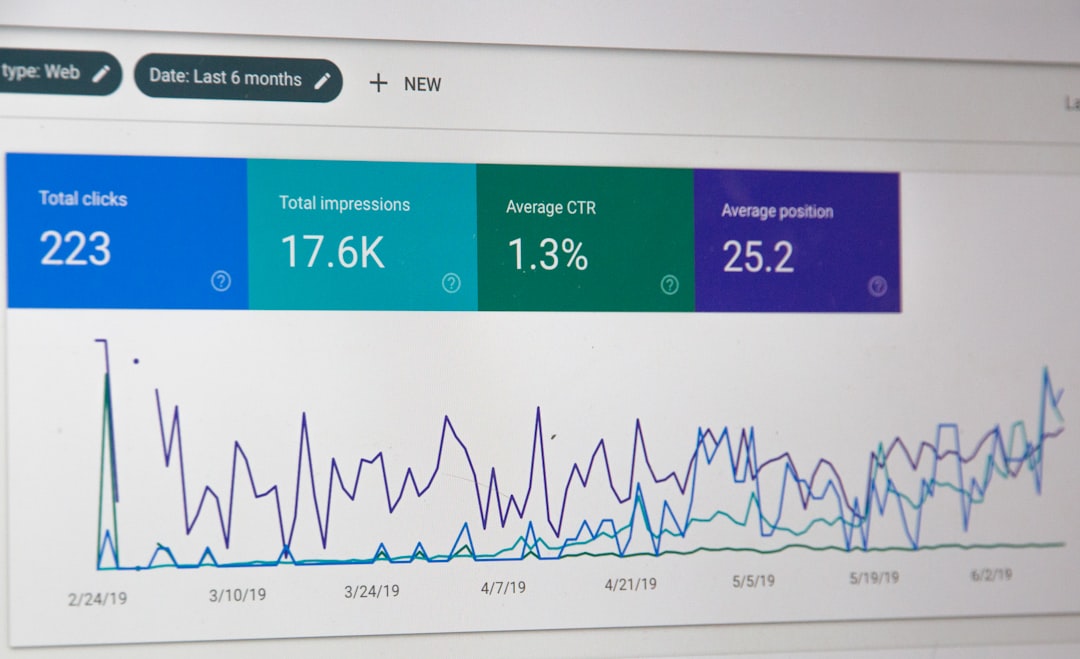
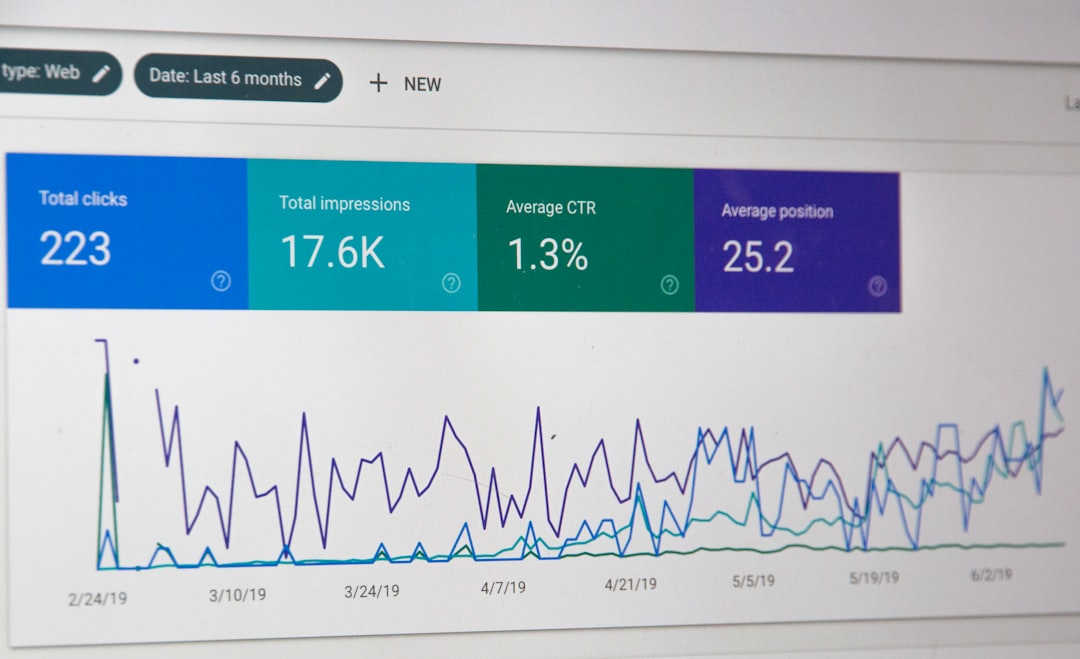
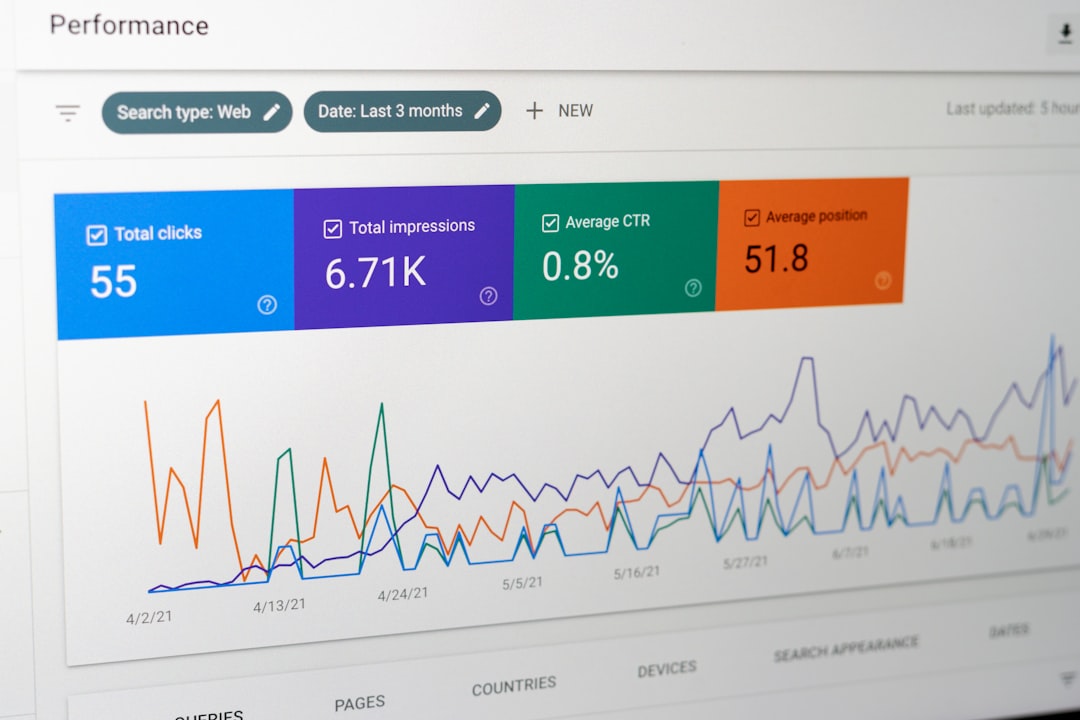
Google Search Console should be your primary SEO dashboard because it shows clicks, impressions, average CTR, and average position from Google Search. Google Analytics 4 adds the behavior layer by showing engagement and key events after visitors land on the site. Used together, they tell you whether low performance comes from weak rankings, weak snippets, weak page experience, or weak conversion paths.
Most site owners do not have one catastrophic SEO problem. They have a stack of smaller issues: pages getting impressions but not clicks, service pages that attract the wrong queries, or technically healthy pages that still fail to convert. If you need the technical side cleaned up first, review our WordPress site speed fixes for SEO and our WordPress SEO strategy for small business to see how measurement fits into the bigger picture.
What metrics actually matter for WordPress SEO
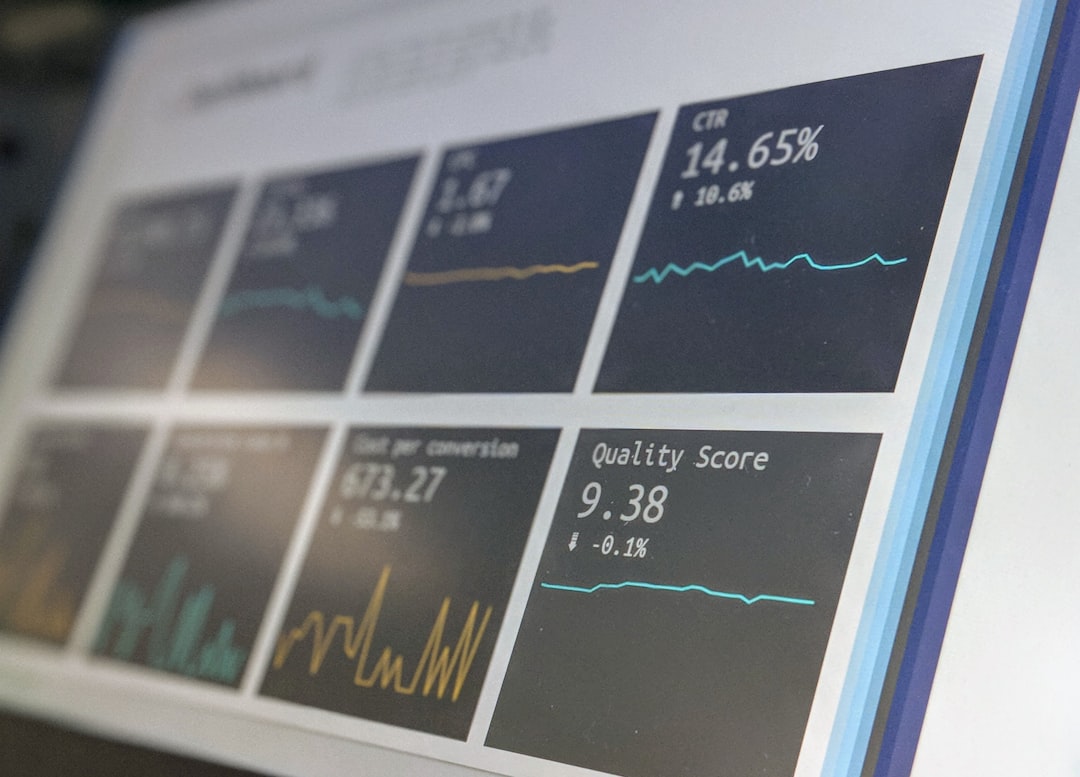
The most useful SEO metrics are the ones that reveal where the bottleneck is. Start with clicks, impressions, CTR, average position, engaged sessions, key events, and page-level conversions. Those numbers help you separate a visibility problem from a messaging problem or a conversion problem.
In Google Search Console, the Performance report shows total clicks, total impressions, average CTR, and average position for your property over the selected time period. In Google Analytics 4, engagement rate is based on engaged sessions, and a session counts as engaged when it lasts longer than 10 seconds, has a key event, or includes 2 or more page or screen views. That combination makes Search Console your ranking and snippet tool, while GA4 becomes your landing-page quality and lead-quality tool.
| Metric | What it tells you | What to do if it is weak |
|---|---|---|
| Impressions | How often your pages appear in Google Search | Improve keyword targeting, internal links, and topical coverage |
| Clicks | How much actual search traffic SEO is generating | Prioritize pages with rising impressions but flat clicks |
| CTR | Whether searchers choose your result | Rewrite titles and meta descriptions to better match intent |
| Average position | Rough visibility trend for queries and pages | Strengthen page depth, internal links, and relevance |
| Engagement rate | Whether visitors meaningfully interact after landing | Tighten page match, improve layout, and clarify next steps |
| Key events or leads | Whether SEO traffic turns into business value | Fix calls to action, forms, and service-page structure |
Use Google Search Console first
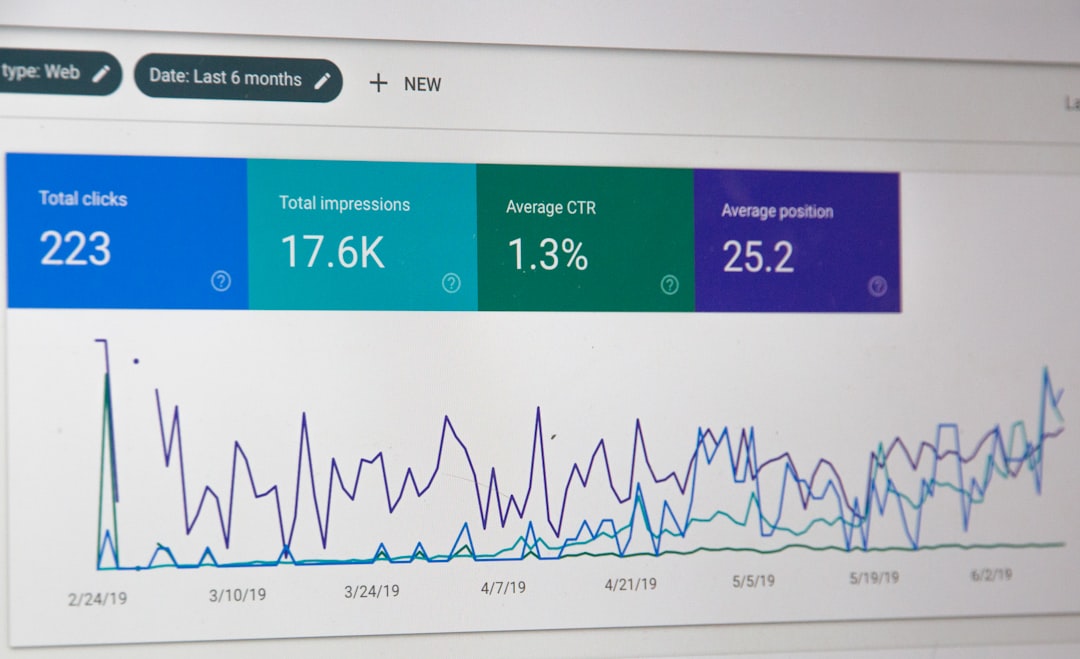
If you only check one platform each week, make it Google Search Console. It gives you the clearest view of how Google is actually surfacing your pages and which queries are creating opportunity. This is where you find pages that are close to performing well but need better targeting or better snippets.
Focus first on the Performance report. Google explains that this report lets you review clicks, impressions, CTR, and average position, and group the data by queries, pages, countries, devices, and dates. That means you can answer practical questions like which service page is losing visibility on mobile, which blog post has high impressions but weak CTR, or which query started sending traffic after a page update.
How to read the four core Search Console metrics
Each metric matters, but not in isolation. Impressions without clicks usually point to weak titles, poor intent match, or rankings that are visible but not competitive. Clicks without conversions often point to the page itself rather than SEO visibility.
Average position is especially easy to misread. Google notes that Search Console reports the average position of the topmost result from your site, and that metrics can differ depending on whether data is aggregated by property or by page. Treat it as a trend signal, not a trophy number. A page moving from an average position of 18 to 11 is often more useful than obsessing over whether one query sits at 7 or 9 on a given day.
A simple weekly Search Console review
A short weekly review is enough for most small business WordPress sites. Look for pages with rising impressions, pages with high impressions and low CTR, queries landing on the wrong page, and pages losing clicks compared to the previous period. That gives you a short list of actions instead of a vague sense that “SEO is down.”
| Check | What to look for | Likely action |
|---|---|---|
| Pages | Top landing pages by clicks and impressions | Protect and improve pages already attracting demand |
| Queries | High-impression terms with weak CTR | Rewrite titles and descriptions to better match search language |
| Compare dates | Pages losing clicks or impressions | Check competitor changes, cannibalization, and technical issues |
| Device split | Mobile underperforming desktop | Review mobile layout, speed, and snippet presentation |
If you are experiencing these symptoms, our team at WordPress SEO Expert can help. A short review often reveals whether the issue is ranking loss, poor CTR, or a page-level conversion problem before you waste time changing the wrong thing.
Use Google Analytics 4 to judge traffic quality

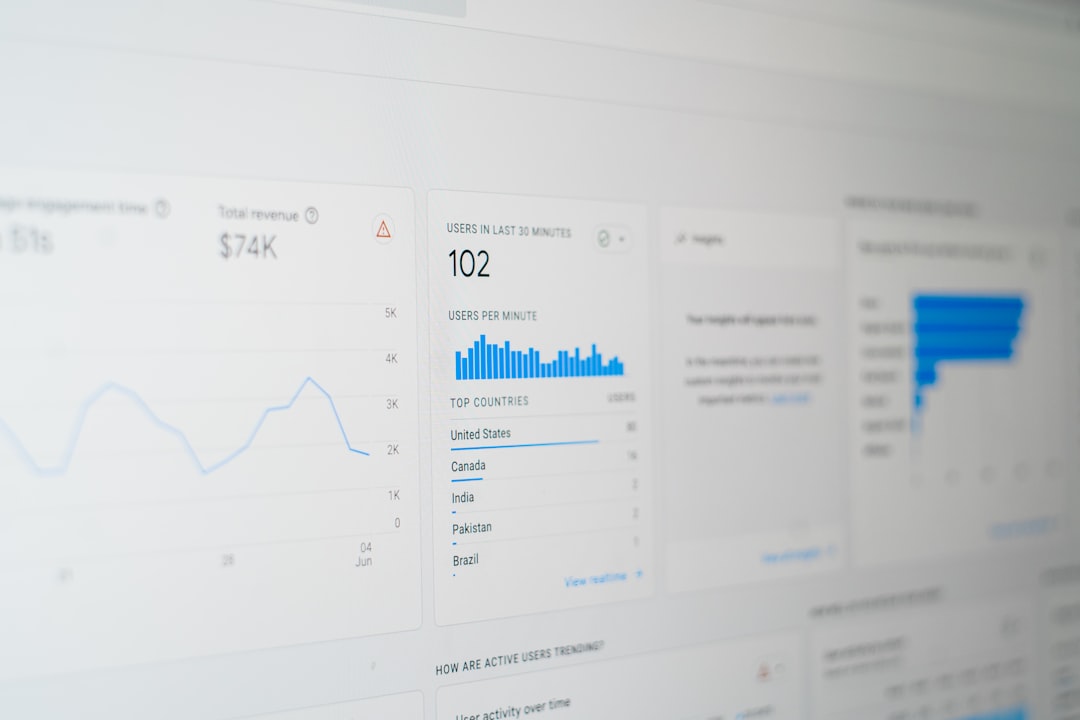
Search Console tells you how people reach the page. Google Analytics 4 tells you what they do after they arrive. That is the difference between measuring visibility and measuring usefulness.
In GA4, watch engagement rate, landing pages, key events, and conversions from organic traffic. Google defines engagement rate as the percentage of engaged sessions, and engaged sessions are those that last longer than 10 seconds, have a key event, or include at least 2 page or screen views. For service businesses, that makes GA4 especially helpful for judging whether traffic is qualified rather than just large.
What to measure in GA4 for SEO
The best GA4 view for SEO is usually landing-page performance filtered to organic search. That shows which pages attract search users, whether those visits are engaged, and whether they lead to calls, forms, purchases, or other key actions.
For a local service site, useful key events might include contact form submissions, phone-click events, appointment requests, or quote requests. For WooCommerce, they might include add-to-cart actions, checkout starts, and purchases. The exact event setup varies, but the principle stays the same: measure whether organic landing pages create business actions, not just sessions.
Track page groups, not just the whole site
Sitewide traffic can hide the real story. Measure core page groups separately so you can see whether the homepage, service pages, blog posts, category pages, or location pages are improving. SEO decisions get clearer when you judge pages by purpose.
A WordPress site often has multiple search roles. Service pages should drive commercial clicks and leads. Blog posts often expand impressions, support internal linking, and introduce earlier-stage searchers. Category or product pages carry more weight on WooCommerce sites. If one group is improving while another is flat, you know where to focus next.
| Page type | Main SEO goal | Primary metric |
|---|---|---|
| Homepage | Brand and broad service visibility | Clicks, branded queries, lead actions |
| Service pages | Commercial intent traffic | Clicks, CTR, conversions |
| Blog posts | Support topical coverage and internal linking | Impressions, clicks, assisted conversions |
| Location pages | Local search visibility | Queries, clicks, phone or form leads |
| Product or category pages | Transactional search traffic | Clicks, add-to-cart actions, purchases |
Measure technical SEO without drowning in tools
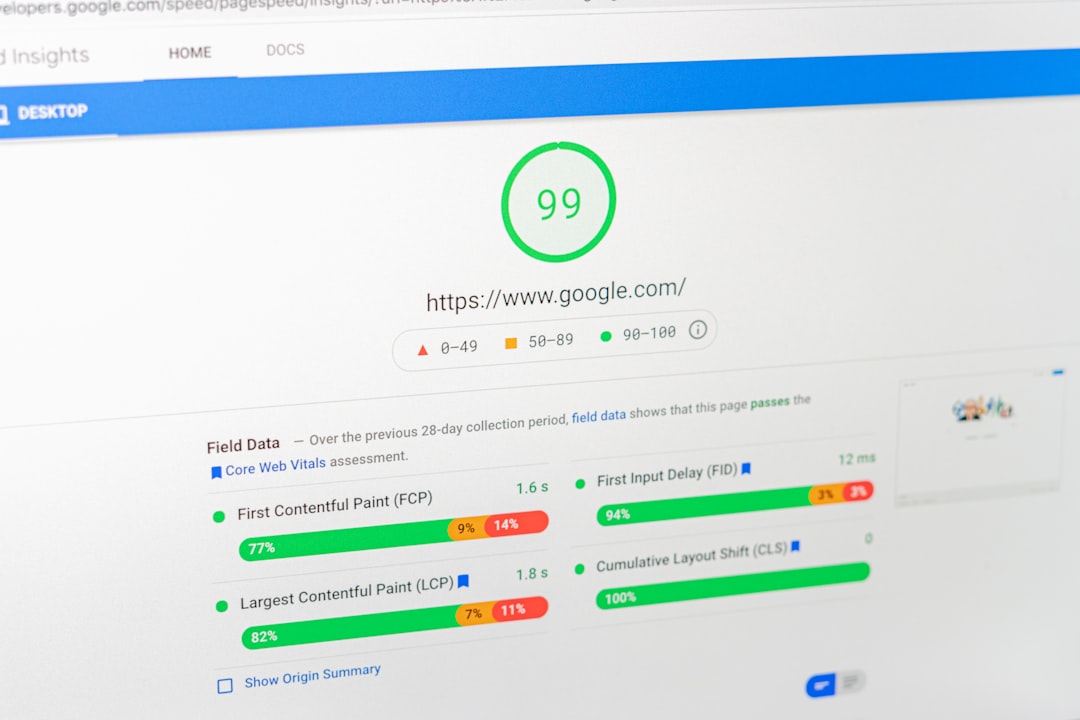
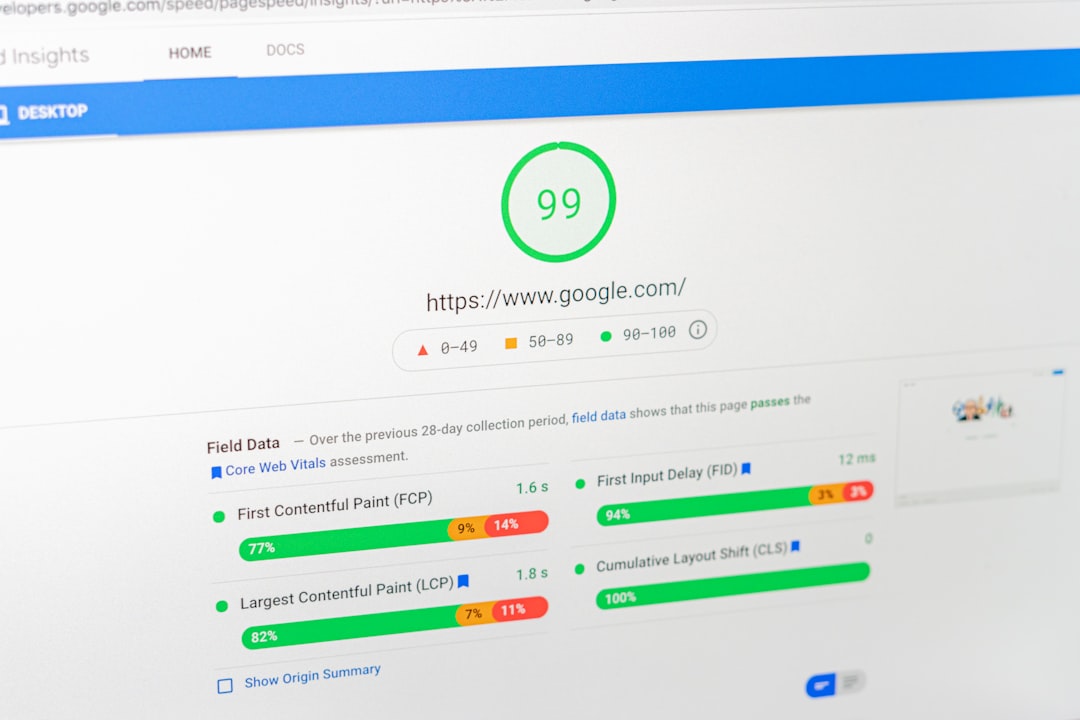
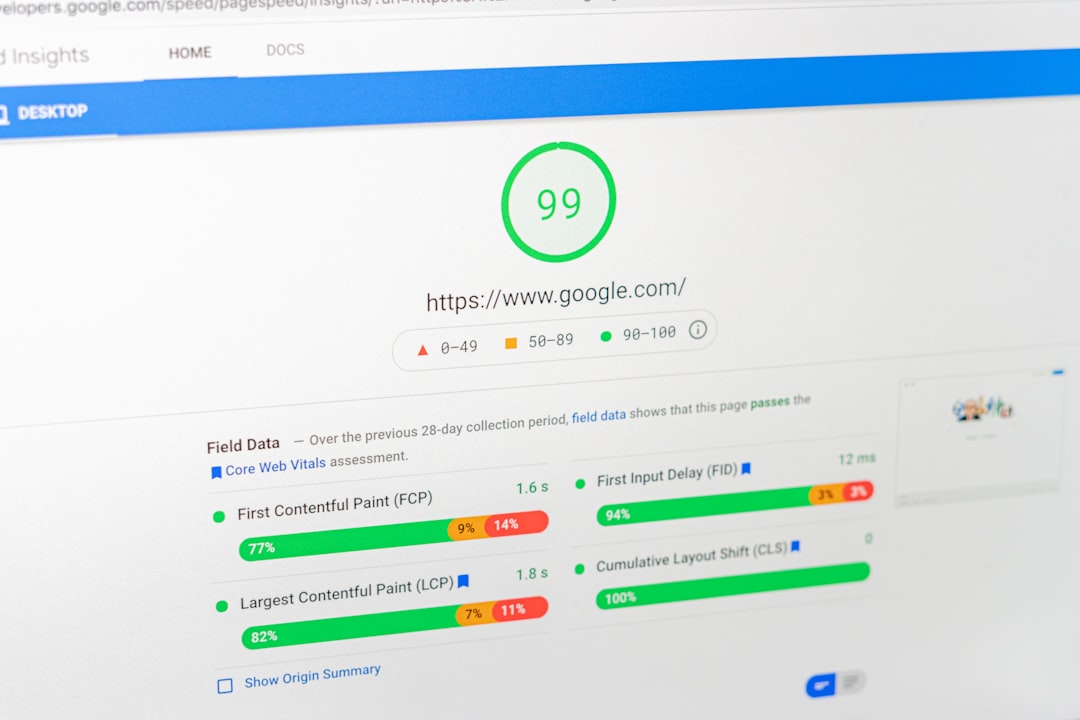
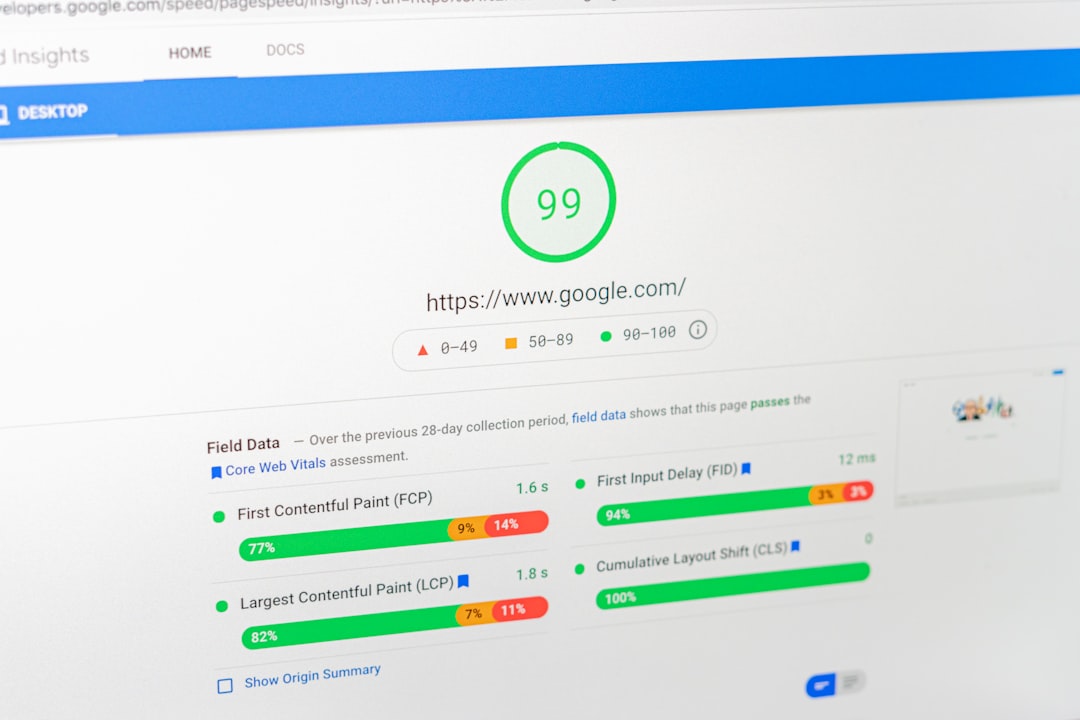
Technical SEO performance matters, but most WordPress sites do not need ten dashboards. Start with indexability, Core Web Vitals, crawl issues, and template consistency. Those are the technical checks most likely to explain why a solid page still underperforms.
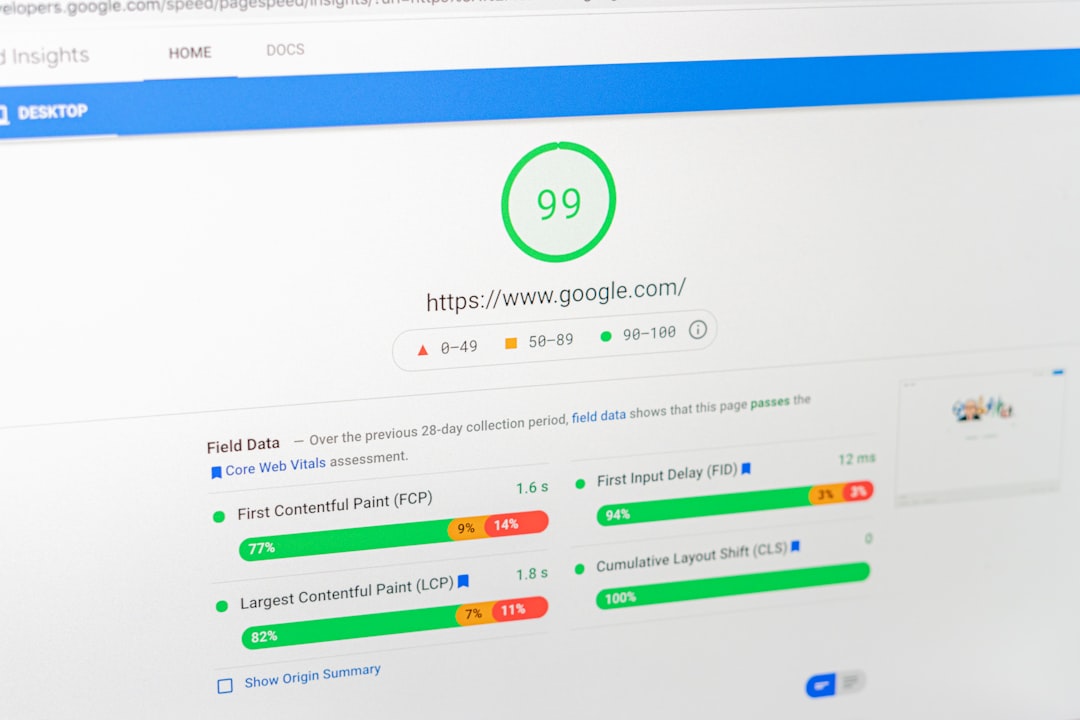
Search Console should again be the first stop. Use the indexing reports to spot pages that should be indexed but are not, and the Core Web Vitals report to see whether Google classifies your URLs as poor, needs improvement, or good based on real user data. If traffic dropped after a redesign or migration, combine those reports with your page-level click trends before rewriting content that may not be the real issue.
For many WordPress sites, technical measurement should answer four questions: are the right pages indexed, are important pages internally linked, are templates fast enough on mobile, and are your plugins creating duplicate or thin URLs. If you need a more practical walkthrough, our guide on improving WordPress site speed for SEO covers one of the biggest technical bottlenecks in plain English.
Build a monthly SEO scorecard
The easiest way to stay consistent is to use one short monthly scorecard. You do not need a complicated reporting deck. You need a repeatable format that shows whether visibility, engagement, and conversions are moving in the right direction.
A practical scorecard should compare this month against the previous month and against the same month in the prior year when possible. Month-over-month catches recent movement. Year-over-year helps account for seasonality. Keep the scorecard small enough that you will actually review it and act on it.
| Area | Metric | Why it matters |
|---|---|---|
| Search visibility | Impressions and average position | Shows whether Google is surfacing your pages more often |
| Traffic | Clicks from organic search | Shows whether visibility is turning into visits |
| Snippet quality | CTR on key pages | Shows whether searchers choose your result |
| Engagement | Engagement rate and engaged sessions | Shows whether visits are meaningful |
| Business outcome | Leads, purchases, or key events | Shows whether SEO supports revenue |
| Technical health | Indexing and Core Web Vitals status | Shows whether avoidable technical friction is holding pages back |
Common measurement mistakes to avoid
Bad measurement usually leads to bad SEO decisions. The most common mistakes are tracking rankings without tracking conversions, judging the whole site instead of page groups, and reacting to short-term noise as if it were a long-term trend.
Another common mistake is treating Search Console data like an exact live feed. Google notes that the newest Performance report data can be preliminary and may change in the next few hours. That is one reason not to panic over a single day. Look for movement across meaningful date ranges, then confirm whether the affected pages, queries, and devices tell the same story.
It also helps to avoid vanity reporting. A page can improve from position 22 to 14 and still drive almost no clicks. Another page can hold a similar average position but double its CTR after a better title rewrite. Measure outcomes that lead to decisions, not metrics that just look impressive in a report.
Final takeaway
Measuring WordPress SEO performance comes down to a simple framework: use Search Console to measure visibility, use GA4 to measure traffic quality, and use conversions to measure business value. When those three layers are reviewed together, it becomes much easier to see what to fix first.
WordPress SEO Expert helps businesses turn scattered SEO data into a clear action plan. If you want a second set of eyes on your reports, page performance, or technical setup, contact WordPress SEO Expert today to schedule a consultation.